Book Review: Malware Analyst's Cookbook and DVD
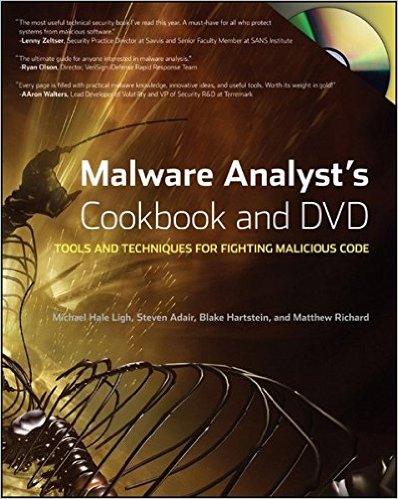
Here is my book review of the Malware Analyst’s Cookbook and DVD: Tools and Techniques for Fighting Malicious Code by Michael Hale Ligh, Steven Adair, Blake Hartstein, and Matthew Richard.

About the Book

The book is a huge compilation of short how-to articles called recipes on the “tools and techniques for fighting malicious code.” In addition, the book comes with a number of very useful custom written tools for automating or speeding up the process. The book is divided into several chapters which specialize on a specific topic. Some of the book’s topics include: Honeypots, Malware Classification, Malware Labs, Malware Forensics, Debugging Malware, Kernel Debugging, Memory Forensics (4 chapters of this)

Initial Impression

I had very high expectations for this book based on the fact that there aren’t many books out there on this subject and it’s something I’m particularly interested in. When I first received the book, I was pleasantly surprised at the literal size and the amount of content: this book is LOADED with information coming in at right close to 700 pages! A quick flip through the book told me that this book covers everything from very basic topics (e.g. using dig) to very advance topics (e.g. kernel debugging). I couldn’t wait to start the book!

The Audience/Skill Level

In the introductory part of the book, it has a small break down of “Who Should Read This Book.” Generally, I would sum it up as anyone and everyone that is interested in security would find this book interesting and entertaining. The book supports a wide range of skills levels from beginners to advanced. A basic knowledge of C/C++ and some Windows API’s is helpful but not required. Likewise, a basic knowledge of Python is not required but would help if you’d like to better understand the scripts that the book provides.

The Book

This isn’t your typical “take-a-seat-and-read” type book. Get your laptop, your desktop, and even some old machines and be prepared to dive right in.

The book focuses mainly on investigating Windows-based malware using tools mainly on Unix/Linux-based OS’es (Ubuntu, Mac OS X, etc) but there are some equivalent Windows based tools which the authors mention if available.

The recipe style of the book makes it very flexible to read and supports a wide range of audiences without confusing the newcomers and boring the advanced. Each recipe is self contained, well written, and easy to read. If you’re not interested in a specific recipe, you can never read it and you’ll have no problems following along in the rest of the book. Where applicable, a recipe provides links to additional information if you would like to take a deeper dive on the topic.

There are basically two approaches to reading this book.

  1. If you’re new to malware analysis, you can start from the beginning and progress to the end, skipping anything you already know or are not interested in, just like you would with any other book.
  2. The other approach would to be use the book as a shelf reference using the table of contents and index to search for what you’re trying to do. The progression of the book is from basic to advanced, so if you’re intermediate or advanced, you can easily skip to the later sections right from the beginning, although in my case I did find some new information, tips, and tools in the basic section that I wasn’t aware of so the basic sections may be worth a quick skim.

The included DVD does prove to be useful unlike other books, not just for following along and understanding a concept, but more importantly, it contains a number of custom Python scripts all geared towards improving and easing your malware analysis. You can easily add these scripts to your toolkits.

No book review would be complete without listing some of it’s downsides. Luckily for this book, there are very few downsides. The first downside is completely unrelated to the content and has to do with the actual book itself. The soft cover binding of the book is somewhat cheap and wears pretty quickly due to the size and weight of the book. A hardcover edition with a solid, strong binding would be a great enhancement. The other downside has to do with the content. While I think the authors make a great effort to minimize the specifics of a tool and focus more generally on the purpose of the tool, there are a few sections of the book which might get outdated quickly if a tool changes. However, I think this is the nature of the beast with technical books so it shouldn’t be something to worry about or prevent you from buying the book!

The Punchline

Whatever topic it is your looking for related to analyzing malware, with The Malware Analyst’s Cookbook: “There’s a recipe for that.”

Interested in analyzing the memory of a rootkit? There’s a recipe for that!

Interested in setting up a malware lab? There’s a recipe for that!

All in all, I would highly recommend this book to anyone interested in security as well as those who want to learn more about malware analysis. I’d also highly recommend this book to professionals in the security field - keep a copy of this book right next to your computer, I guarantee you’ll find it useful!

Mac OS X 64 bit Assembly System Calls

After reading about shellcode in Chapter 5 of Hacking: The Art of Exploitation, I wanted to go back through some of the examples and try them out. The first example was a simple Hello World program in Intel assembly. I followed along in the book and had no problems reproducing results on a 32 bit Linux VM using nasm with elf file format and ld for linking.

Then I decided I wanted to try something similar but with a little bit of a challenge: write a Mac OS X 64 bit “hello world” program using the new fast ‘syscall’ instruction instead of the software interrupt based (int 0x80) system call, this is where things got interesting. First and foremost, the version of Nasm that comes with Mac OS X is a really old version. If you want to assemble macho64 code, you’ll need to download the lastest version.

nobody@nobody:~$ nasm -v
NASM version 2.09.03 compiled on Oct 27 2010

I figured I could replace the extended registers with the 64 bit registers and the int 0x80 call with a syscall instruction so my first attempt was something like this

section .data
hello_world     db      "Hello World!", 0x0a

section .text
global _start

_start:
mov rax, 4              ; System call write = 4
mov rbx, 1              ; Write to standard out = 1
mov rcx, hello_world    ; The address of hello_world string
mov rdx, 14             ; The size to write
syscall                 ; Invoke the kernel
mov rax, 1              ; System call number for exit = 1
mov rbx, 0              ; Exit success = 0
syscall                 ; Invoke the kernel

After assembling and linking, I got this

nobody@nobody:~$ nasm -f macho64 helloworld.s
nobody@nobody:~$ ld helloworld.o 
ld: could not find entry point "start" (perhaps missing crt1.o) for inferred architecture x86_64

Apparently Mac OS X doesn’t use _start for linking, instead it just uses start. After removing the underscore prefix from start, I was able to link but after running, I got this

nobody@nobody:~$ ./a.out
Bus error

I was pretty stumped at this point so I headed off to Google to figure out how I was supposed to use the syscall instruction. After a bunch of confusion, I stumbled upon the documentation and realized that x86_64 uses entirely different registers for passing arguments. From the documentation:

 
The number of the syscall has to be passed in register %rax.
    
rdi - used to pass 1st argument to functions
rsi - used to pass 2nd argument to functions
rdx - used to pass 3rd argument to functions
rcx - used to pass 4th argument to functions
r8 - used to pass 5th argument to functions
r9 - used to pass 6th argument to functions
    
A system-call is done via the syscall instruction. The kernel destroys registers rcx and r11.

So I tweaked the code with this new information

...
mov rax, 4              ; System call write = 4
mov rdi, 1              ; Write to standard out = 1
mov rsi, hello_world    ; The address of hello_world string
mov rdx, 14             ; The size to write
syscall                 ; Invoke the kernel
mov rax, 1              ; System call number for exit = 1
mov rdi, 0              ; Exit success = 0
syscall                 ; Invoke the kernel
...

And with high hopes that I’d see “Hello World!” on the console, I still got the exact same ‘Bus error’ after assembling and linking.

Back to Google to see if others had tried a write syscall on Mac OS X. I found a few posts of people having success with the syscall number 0x2000004 so I thought I’d give it a try. Similarly, the exit syscall number was 0x2000001. I tweaked the code and BINGO! I was now able to see “Hello World” output on my console but I was seriously confused at this point; what was this magic number 0x200000 that is being added to the standard syscall numbers?

I looked in syscall.h to see if this was some sort of padding (for security?) I greped all of /usr/include for 0x2000000 with no hints what-so-ever. I looked into the Mach-o file format to see if it was related to that with no luck.

After about an hour and a half of looking, I spotted what I was looking for in ‘syscall_sw.h’

/*
 * Syscall classes for 64-bit system call entry.
 * For 64-bit users, the 32-bit syscall number is partitioned
 * with the high-order bits representing the class and low-order
 * bits being the syscall number within that class.
 * The high-order 32-bits of the 64-bit syscall number are unused.
 * All system classes enter the kernel via the syscall instruction.
 *
 * These are not #ifdef'd for x86-64 because they might be used for
 * 32-bit someday and so the 64-bit comm page in a 32-bit kernel
 * can use them.
 */
#define SYSCALL_CLASS_SHIFT	24
#define SYSCALL_CLASS_MASK	(0xFF << SYSCALL_CLASS_SHIFT)
#define SYSCALL_NUMBER_MASK	(~SYSCALL_CLASS_MASK)

#define SYSCALL_CLASS_NONE	0	/* Invalid */
#define SYSCALL_CLASS_MACH	1	/* Mach */	
#define SYSCALL_CLASS_UNIX	2	/* Unix/BSD */
#define SYSCALL_CLASS_MDEP	3	/* Machine-dependent */
#define SYSCALL_CLASS_DIAG	4	/* Diagnostics */

Mac OS X or likely BSD has split up the system call numbers into several different “classes.” The upper order bits of the syscall number represent the class of the system call, in the case of write and exit, it’s SYSCALL_CLASS_UNIX and hence the upper order bits are 2! Thus, every Unix system call will be (0×2000000 + unix syscall #).

Armed with this information, here’s the final x86_64 Mach-o “Hello World”

section .data
hello_world     db      "Hello World!", 0x0a

section .text
global start

start:
mov rax, 0x2000004      ; System call write = 4
mov rdi, 1              ; Write to standard out = 1
mov rsi, hello_world    ; The address of hello_world string
mov rdx, 14             ; The size to write
syscall                 ; Invoke the kernel
mov rax, 0x2000001      ; System call number for exit = 1
mov rdi, 0              ; Exit success = 0
syscall                 ; Invoke the kernel

And here’s the output

nobody@nobody:~$ nasm -f macho64 helloworld.s
nobody@nobody:~$ ld helloworld.o 
nobody@nobody:~$ ./a.out
Hello World!

How is glibc loaded at runtime?

I’ve been looking into address-space layout randomization (ASLR). ASLR relies on randomizing the base address of things like shared libraries, making return-to-libc attacks more difficult.

I understood the basics of ASLR but I still had a lot of questions. How are shared libraries, like libc, loaded at runtime? What is the global offset table? What is the procedure linkage table? What is a position independent executable? In this post, we’re going to look at all of these.

Back in the Day

In “the olden days” libraries used to be hard coded to be loaded at a fixed address in memory space. Runtime linkers had to deal with relocating conflicting hard coded addresses. Windows, to some extent, still does this.

PIC - Position Independent Code

Then came along Position Independent Code which simply means that the code (usually shared libraries) can be loaded at any address in memory-space and relocations are no longer a problem. In order to do that, binaries added sections for the GOT and the PLT.

Global Offset Table

Every ELF executable has a section called the Global Offset Table or the GOT for short. This table is responsible for holding the absolute address of functions in shared libraries linked dynamically at runtime.

nobody@nobody:~$ objdump -R ./hello_world

./hello_world:     file format elf32-i386

DYNAMIC RELOCATION RECORDS
OFFSET   TYPE              VALUE
08049564 R_386_GLOB_DAT    __gmon_start__
08049574 R_386_JUMP_SLOT   __gmon_start__
08049578 R_386_JUMP_SLOT   __libc_start_main
0804957c R_386_JUMP_SLOT   printf
Procedure Linkage Table

Just like the GOT, every ELF executable also has a section called the Procedure Linkage Table or PLT for short (not to be confused with BLT (Bacon Lettuce Tomato) :-) ). If you’ve read disassembled code, you’ll often see function calls like printf@plt. That’s a call to the printf in the procedure linking table. The PLT is sort of like the spring board that allows us to resolve the absolute addresses of shared libraries at runtime.

nobody@nobody:~$ objdump -d -j .plt ./hello_world

./hello_world:     file format elf32-i386

Disassembly of section .plt:

08048270 <__gmon_start__@plt-0x10>:
 8048270:       ff 35 6c 95 04 08       pushl  0x804956c
 8048276:       ff 25 70 95 04 08       jmp    *0x8049570
 804827c:       00 00                   add    %al,(%eax)

08048280 <__gmon_start__@plt>:
 8048280:       ff 25 74 95 04 08       jmp    *0x8049574
 8048286:       68 00 00 00 00          push   $0x0
 804828b:       e9 e0 ff ff ff          jmp    8048270 <_init+0x18>

08048290 <__libc_start_main@plt>:
 8048290:       ff 25 78 95 04 08       jmp    *0x8049578
 8048296:       68 08 00 00 00          push   $0x8
 804829b:       e9 d0 ff ff ff          jmp    8048270 <_init+0x18>

080482a0 <printf@plt>:
 80482a0:       ff 25 7c 95 04 08       jmp    *0x804957c
 80482a6:       68 10 00 00 00          push   $0x10
 80482ab:       e9 c0 ff ff ff          jmp    8048270 <_init+0x18>
The GOT, The PLT, and the Linker

How do these all work together to load a shared library at runtime? Well it’s actually pretty cool. Lets walk through the first call to printf. printf@plt, which is not really printf but a location in the PLT, is called and the first jump is executed.

080482a0 <printf@plt>:
 80482a0:       ff 25 7c 95 04 08       jmp    *0x804957c
 80482a6:       68 10 00 00 00          push   $0x10
 80482ab:       e9 c0 ff ff ff          jmp    8048270 <_init+0x18>

Notice that this jump is a pointer to an address. We’re going to jump to the address pointed to by this address. The 0x804957c is an address in the GOT. The GOT will eventually hold the absolute address call to printf, however, on the very first call the address will point back to the instruction after the jump in the PLT - 0x80482a6. We can see this below by looking at the output of the GOT. Essentially we’ll execute all of the instructions of the printf@plt the very first call.

(gdb) x/8x 0x804957c-20
0x8049568 <_GLOBAL_OFFSET_TABLE_>:      0x0804949c      0xb80016e0      0xb7ff92f0      0x08048286
0x8049578 <_GLOBAL_OFFSET_TABLE_+16>:   0xb7eafde0      0x080482a6      0x00000000      0x00000000

In the PLT code, an offset is pushed onto the stack and another jmp is executed

080482a0 <printf@plt>:
 80482a0:       ff 25 7c 95 04 08       jmp    *0x804957c
 80482a6:       68 10 00 00 00          push   $0x10
 80482ab:       e9 c0 ff ff ff          jmp    8048270 <_init+0x18>

This jump is a jump into the eventual runtime linker code that will load the shared library which contains printf. The offset, $0x10, that was pushed onto the stack tells the linker code the offset of the symbol in the relocation table (see objdump -R ./hello_world output above), printf in this case. The linker will then write the address of printf into the GOT at 0x804957c. We can see this if we look at the GOT after the library has been loaded.

(gdb) x/8x 0x804957c-20
0x8049568 <_GLOBAL_OFFSET_TABLE_>:      0x0804949c      0xb80016e0      0xb7ff92f0      0x08048286
0x8049578 <_GLOBAL_OFFSET_TABLE_+16>:   0xb7eafde0      0xb7edf620      0x00000000      0x00000000

Notice that the previous address, 0x80482a6, has been replaced by the linker with 0xb7edf620. To confirm that this indeed is the address for printf, we can start a disassemble at this address

(gdb) disassemble 0xb7edf620
Dump of assembler code for function printf:
...

Since the library is now loaded and the GOT has been overwritten with the absolute address to printf, subsequent calls to the function printf@plt will jump directly to the address of printf! All of this also has the added benefit that a shared library is not loaded until a function in it’s library is loaded – in other words, a nice form of “lazy-loading!”